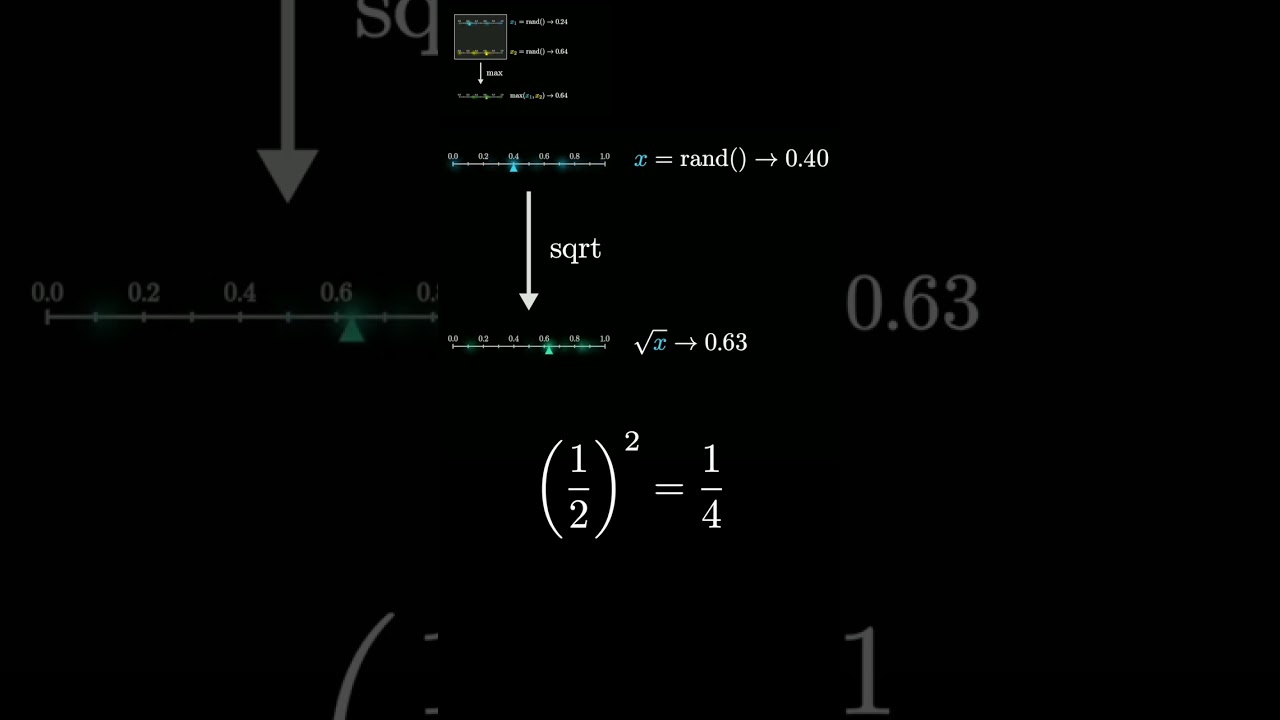
The video explores how two different methods of generating random numbers between 0 and 1—calculating the maximum of two uniformly sampled numbers and taking the square root of a single random number—result in the same distribution, both skewed towards larger values. This surprising connection challenges intuition and highlights the beauty of mathematics, encouraging viewers to consider the underlying principles linking these seemingly unrelated operations.
In the video, the presenter shares an intriguing probability fact demonstrated by Matt Parker. The focus is on two different methods of generating random numbers between 0 and 1 and how they both lead to a similar outcome in terms of distribution. The first method involves taking two numbers that are uniformly sampled from the interval [0, 1] and calculating their maximum. This operation tends to produce larger values, creating a bias towards higher numbers in the resulting distribution.
The second method discussed is taking a single random value from the same interval and computing its square root. Since squaring a number between 0 and 1 results in a smaller value, taking the square root of that smaller number will yield a larger result. This process also skews the distribution towards larger numbers, similar to the maximum operation. The presenter highlights the surprising nature of these two seemingly unrelated operations yielding the same distribution.
The video emphasizes the idea that both methods—finding the maximum of two random numbers and taking the square root of one random number—result in identical distributions. This revelation challenges our intuition, as it seems counterintuitive that a mathematical operation like taking a square root could produce the same effect as calculating a maximum. The presenter encourages viewers to consider the underlying principles that connect these two operations.
To illustrate this concept further, the presenter suggests that a visual representation can help clarify why these two methods yield the same distribution. By drawing the appropriate diagrams, one can better understand the relationship between the maximum of two random variables and the square root of a single random variable. This visual approach can reveal the underlying mathematical properties that govern these operations.
In conclusion, the video presents a fascinating exploration of probability and distribution, showcasing how two different mathematical operations can lead to the same outcome. The discussion encourages viewers to think critically about the connections between seemingly unrelated concepts in probability and to appreciate the beauty of mathematics in revealing such surprising relationships.
