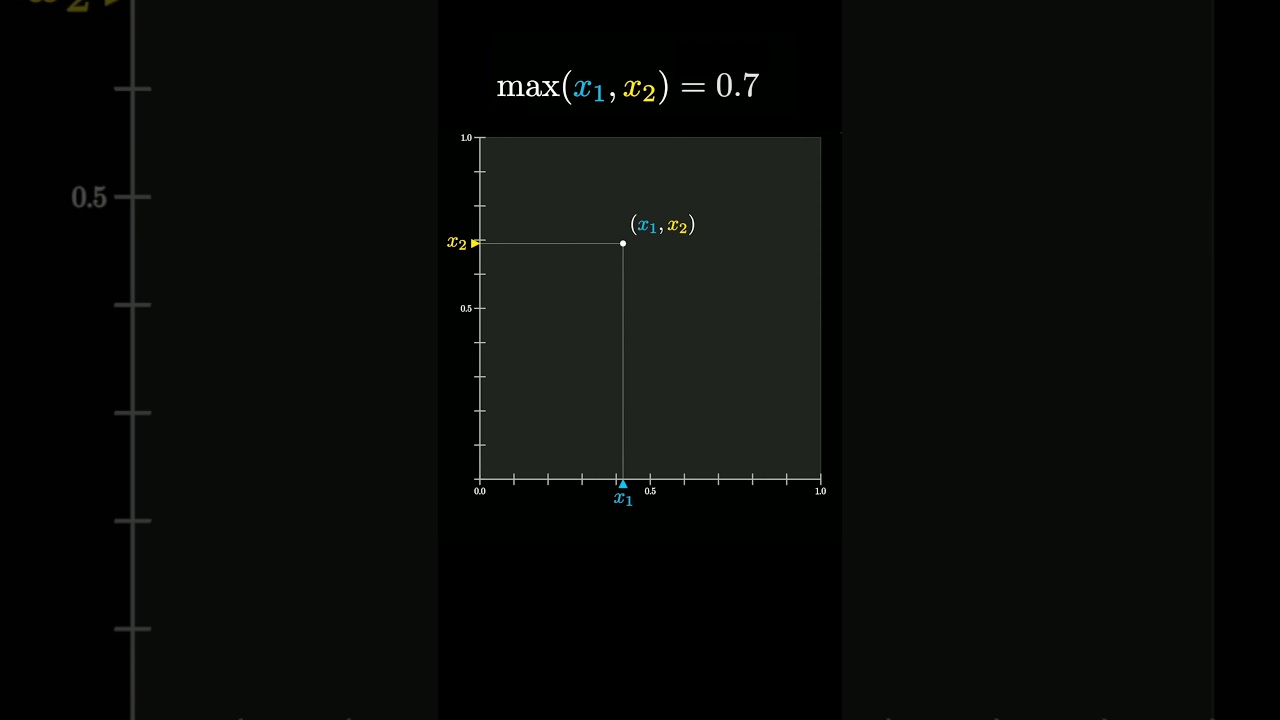
The video explores a cute probability fact involving two random values, x1 and x2, chosen uniformly from the interval between 0 and 1, and visualizes them as points within a 1 by 1 square. It focuses on the conditions under which the maximum of these values equals a specific number, such as 0.7, using geometric interpretations to illustrate the corresponding areas in the square that contribute to calculating related probabilities.
In this video, the presenter explores a cute probability fact involving two random values, referred to as x1 and x2. Both values are uniformly chosen from the interval between 0 and 1. By visualizing these values in a two-dimensional space, they can be represented as points within a 1 by 1 square. This setup allows for a deeper understanding of the relationships between the two random variables.
The focus of the discussion is on the maximum of the two values, specifically when it equals a certain number, such as 0.7. The presenter illustrates how this can occur by considering different scenarios for x1 and x2. For instance, if x1 is equal to 0.7, then x2 must be any value less than 0.7, which corresponds to a vertical line in the square. Conversely, if x2 is equal to 0.7, x1 must be smaller than that, represented by a horizontal line.
This geometric interpretation helps to visualize the conditions under which the maximum of the two values can be constrained to a specific number. The presenter emphasizes that both scenarios contribute to the overall area within the square where the maximum value is 0.7. This area is crucial for calculating probabilities related to the maximum of the two random variables.
The video likely continues to delve into the implications of these geometric representations, possibly discussing how to calculate the probability that the maximum of x1 and x2 falls within a certain range. By using the visual model, the presenter can effectively convey complex probability concepts in a more intuitive manner.
Overall, the video serves as an engaging introduction to understanding the behavior of random variables and their maximum values through a visual and geometric lens, making the topic accessible and interesting for viewers.
