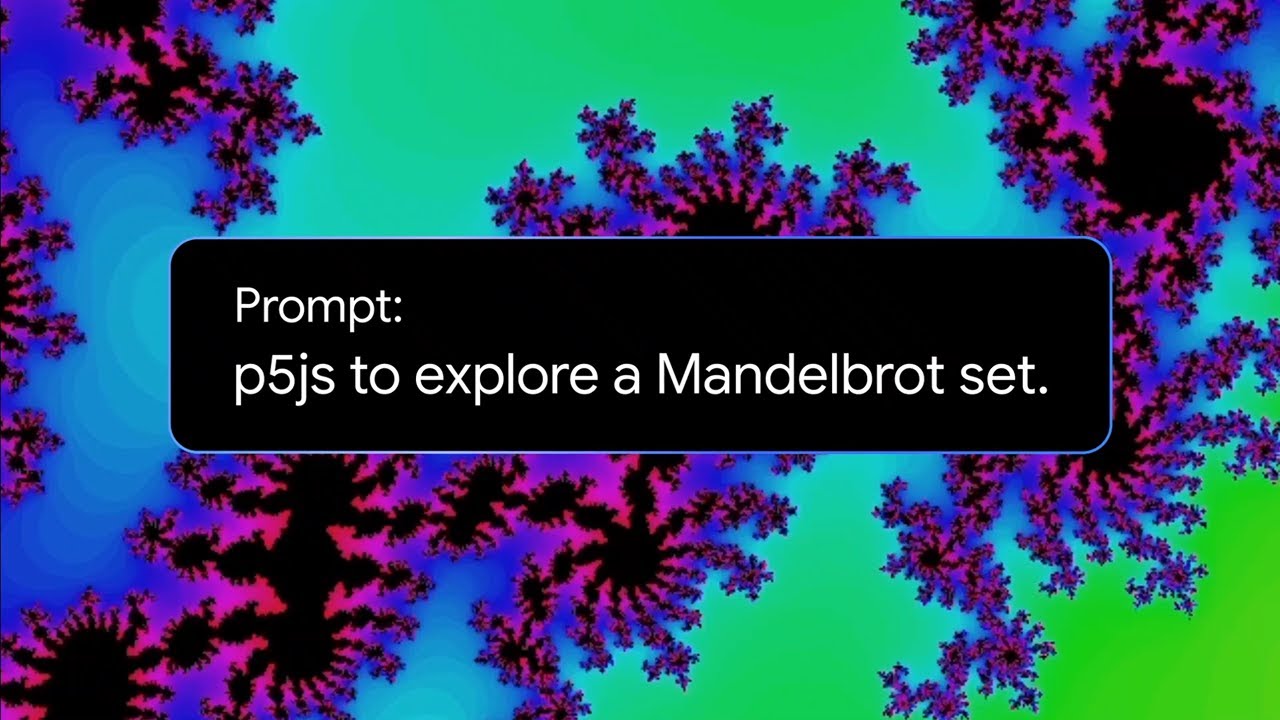
The video teaches viewers how to visualize the Mandelbrot set by explaining its mathematical foundation and guiding them through the coding process using a specific programming language and libraries. It covers the iterative function for determining point divergence, rendering techniques, and color mapping to create vibrant fractal images, encouraging experimentation with parameters and color schemes.
The video demonstrates how to create a visualization of the Mandelbrot set using programming techniques. It begins by introducing the concept of the Mandelbrot set, which is a complex mathematical structure that is famous for its intricate and beautiful fractal patterns. The presenter explains the mathematical foundation behind the set, including the iterative process used to determine whether a point in the complex plane belongs to the Mandelbrot set.
Next, the video delves into the coding aspect, showcasing the programming language and tools used for the visualization. The presenter outlines the necessary libraries and functions required to generate the fractal image. Viewers are guided through the process of setting up the environment and writing the initial code to define the parameters of the Mandelbrot set, such as the range of values for the real and imaginary axes.
As the coding progresses, the video highlights the importance of the iterative function used to calculate the Mandelbrot set. The presenter explains how each point is tested for divergence, which determines its color in the final visualization. This section includes a detailed explanation of the algorithm, emphasizing the significance of performance optimization to handle the potentially large number of iterations required for a high-resolution image.
The video also covers the process of rendering the fractal image, including how to map the calculated values to colors for visual representation. The presenter demonstrates how to create a color palette and apply it to the points in the set based on their divergence rates. This step is crucial for producing the vibrant and visually appealing images that the Mandelbrot set is known for.
Finally, the video concludes with a demonstration of the final output, showcasing the stunning visualizations created from the code. The presenter encourages viewers to experiment with different parameters and color schemes to explore the vast possibilities of the Mandelbrot set. The video serves as both an educational resource for understanding fractals and a practical guide for coding visualizations in programming.
