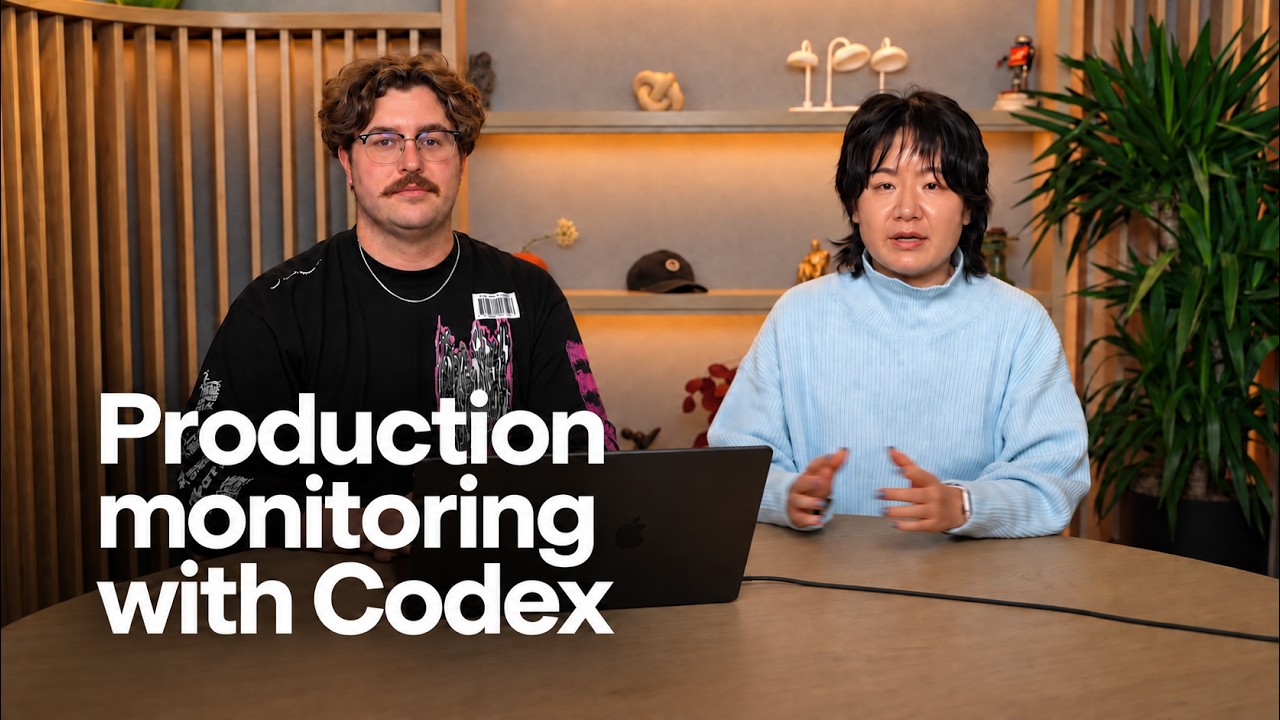
The video begins by illustrating a common nightmare scenario for engineers: receiving an alert at 3:00 a.m. about rising checkout errors. The initial challenge is determining what has changed and what is affected. Traditionally, this involves manually gathering data from dashboards like Grafana, deployment contexts, and relevant code, which can be time-consuming and repetitive. The video introduces Codex as a solution to automate this investigative process. In the example, after deploying a new version (v2) of the application, checkout errors spike to 20%. Codex quickly analyzes various metrics such as successful checkouts, response times, and service health, identifies the issue, proposes a fix, and upon human approval, deploys a patch that resolves the problem without reverting to an older release.
The discussion then shifts to how Codex integrates with Kubernetes and containerized environments. The example shows a deployment of a new inventory API version within a Kubernetes cluster that passes CI/CD but experiences an out-of-memory (OOM) kill, causing cascading failures across the cluster. Using a Kubernetes rollout investigator skill, Codex identifies the root cause and causal chain of the failure. After proposing a fix and receiving approval, Codex rolls out a healthy version of the inventory API, restoring the cluster’s overall functionality. This process mirrors the earlier example but highlights Codex’s capability to handle complex container orchestration environments efficiently.
Throughout both scenarios, the video emphasizes the benefit of offloading manual data gathering and troubleshooting to Codex, which acts as an intelligent agent. Engineers remain in the loop to approve fixes, significantly reducing the time from alert to resolution—from potentially an hour to just minutes. Additionally, the video mentions the possibility of fully automating this process by hosting Codex runners within Kubernetes or Grafana, enabling Codex to monitor alerts, propose fixes, and even validate and deploy them autonomously without human intervention, using a multi-agent system.
The video also explores the intersection of production monitoring and security through Codex’s security plugin. In a scenario where no recent deployment occurred, a single report request was found to be starving the checkout service by consuming excessive shared worker pool resources. Codex’s security plugin automatically generates a patch to block this expensive request, which, once approved and applied, resolves the issue. This example demonstrates how security tools can complement production monitoring to maintain service availability and performance, highlighting the versatility and power of Codex’s integrated approach.
Finally, the presenters encourage viewers to explore Codex’s capabilities further and offer support for any questions or discussions. They highlight the potential for many additional use cases and lateral applications of Codex in both production monitoring and security domains. The video concludes by inviting engagement and collaboration, emphasizing Codex as a powerful tool to streamline incident response, improve system reliability, and enhance security posture in modern software environments.
Useful Links